Monitoring message flows has been of concern to many customers since the beginning of IBM Integration Bus. IBM Integration Bus monitoring tool consists of the performance monitoring tools that reveals the current server’s throughput rates, with several metrics that directly draws attention to performance bottlenecks and spikes in demand.
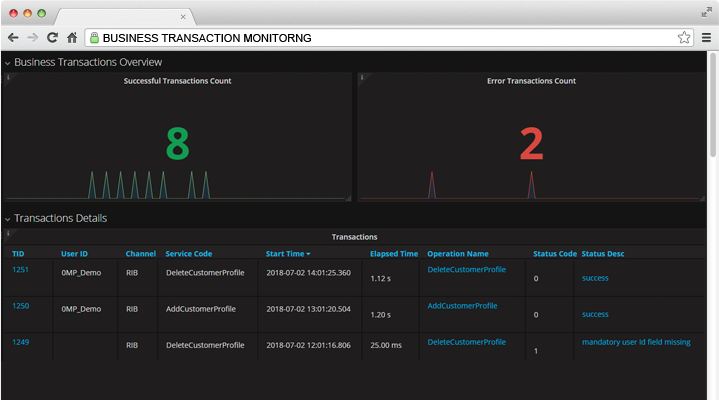
Overview of the main business transaction monitoring dashboard. It gives an overview of total number of successful and unsuccessful transactions within a specified time frame with a list of all the transactions.
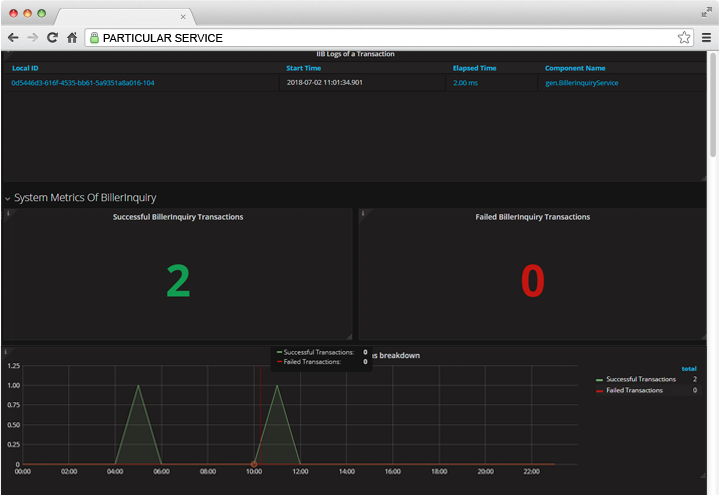
Local log details of a particular service transaction in IIB and also shows the success and failed transactions of a particular service
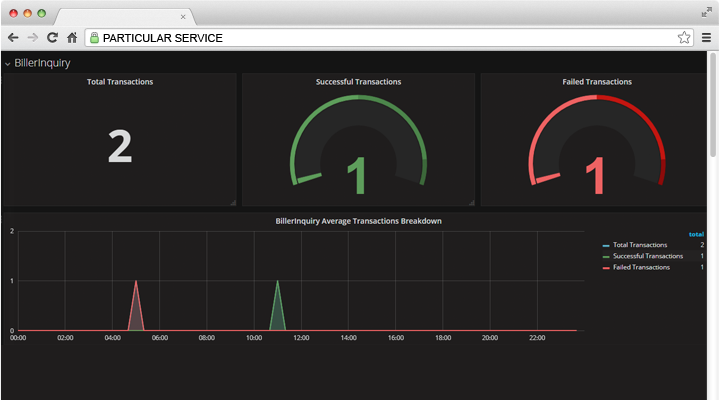
The total number of successful and failed transaction of a particular service and average transaction breakdown
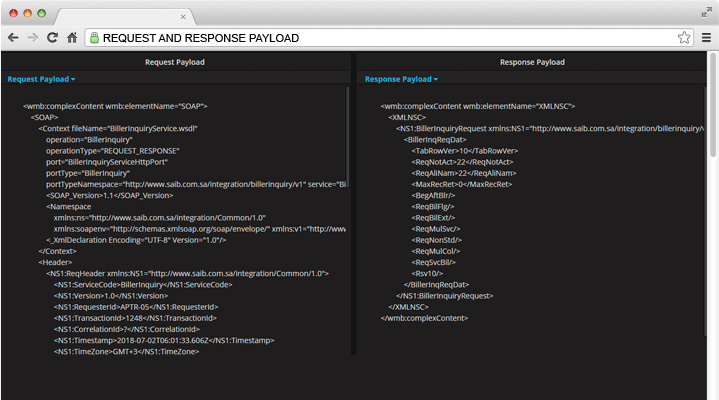
The request and response payload for a particular transaction
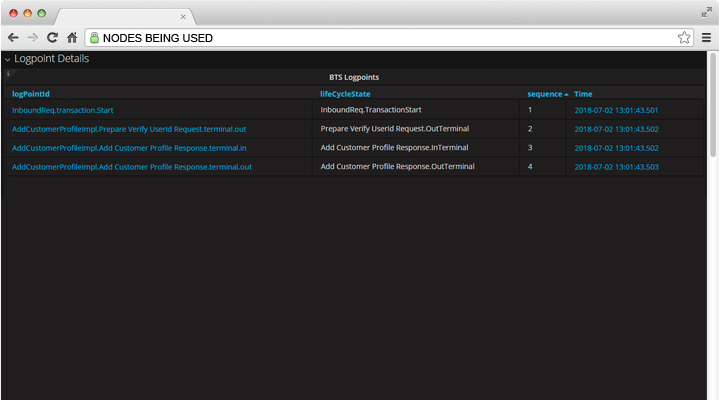
The details about the nodes being used in the IIB service
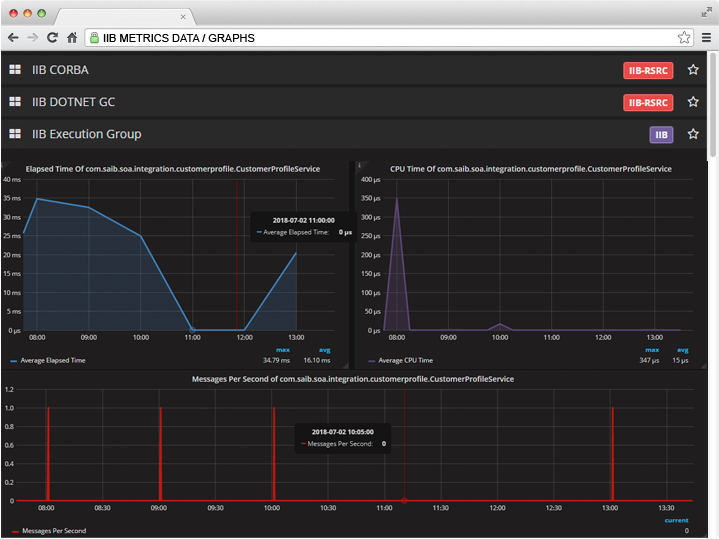
The list of different dashboards that shows the IIB metrics data/graphs
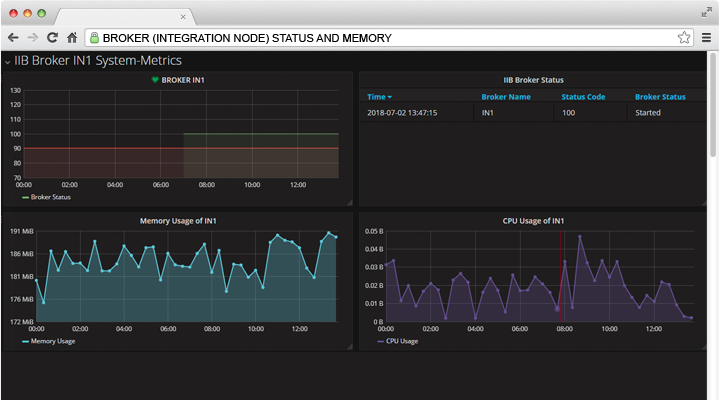
Dashboard of the broker (integration node) status and memory, the CPU used by broker
Functional Benefits
Tracks the transaction and its status
Provides reports based on the collected data for every transaction
Helps the business to analysis and prepare strategies from the reports
Reduces cost and complexity of IT systems
Technical Benefits
Avoids message flow re-deployment to enable monitoring
Simple XML contains all the configurations to emit monitoring events.
Addresses all questions related to a message processing.
Schedule a Meeting with Our Experts
Sign up with Royal Cyber for a consultation to help you understand
IBM Integration Bus Monitoring Tool